You may want to read this recent post prior to this one:
Given that SYS3 (Pace) seems to be our most popular system, I thought it was worth doing a deep dive into some important underlying statistics. Thankfully, there’s a lot more good than ugly. In fact, there is nothing ugly when you consider its performance against its historic strike rate. Moreover, I’m pleased to report that everything is well within the parameters expected for this system.
SYS3 (Pace) has a current strike just above 17%.
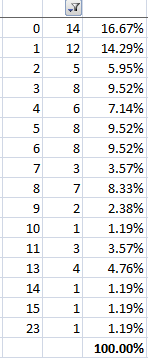
Working from these figures, the ELLR (estimated longest losing run) for this system is 33. Essentially, this means the most consecutive losers we should have encountered for this number of bets at a strike rate of 17.14%. So what is the actual most consecutive number of losers we’ve had for this system across the 490 bets to date? The answer to that question is 23. Please see here:
The above shows the number of bets needed before finding the next winner. At the bottom, you will see the number 23. This is showing us that one time we had to wait 23 bets before finding our next winner (that was the longest wait we’ve had). Waiting 23 bets for a winner is never the most enjoyable experience; however, it’s well within the expected parameters given that the ELLR amount is showing as 33. So we could have had a longer wait than 23. The next longest wait was 15 bets without a winner. And the third longest wait was 14 without a winner. And four times we’ve had to wait 13 bets before finding our next winner.
Thankfully, the numbers repeat a lot more at the top end of the scale. So notice that 14 times we’ve not had to wait more than a single bet for our next winner, so where it shows 0, this essentially means we had a winner and then another winner straight afterwards. And 12 times we’ve had a winner, followed by a loser, followed by another winner. Most of the time, the next winner comes from somewhere between the next 6 or 7 bets. But sometimes we’ve needed to be patient and wait longer for our next SYS3 (Pace) winner to romp in.
Talking of patience, how long has the system had to wait before finding its next new high on the overall profit and loss line chart? Here are the stats for this:
So the longest wait we’ve had to date is 42 days, which occurred between 01/02/24 and 14/03/24. A wait of 42 days might sound like quite a long wait, but actually, it’s nothing when compared to the much longer waits one is forced to endure when investing in the stock market. I’ve actually discussed this topic previously; please see the post here.
Reaching all-time highs: SYS3 vs. the stock market
Yesterday, I wrote this post: Towards the end, I wrote the following: The system is not going to hit new highs every week. To pretend otherwise is plain daft. No investment in the stock market ever reaches new all-time highs every week. Why should horse racing be any different? In fact, most stocks or shares take months (or more often years!) to recover a…


