A crystal ball to foretell when the tide is about to turn?
A crystal ball to foretell when the tide is about to turn?
Advance clues about major shifts in momentum

Wouldn’t it be nice to have a crystal ball for horse racing to help us foretell when our fortune is about to swing from the upside to the downside? Obviously, there is no such fail-safe magical method to enable one to predict the inevitable swings, up or down, in advance. However, there is a certain method that can give us some clue, at least. So, for example, whenever we’re hitting a purple patch where we bag some nice-priced winners in quick succession, logic should immediately tell us that it’s unrealistic to expect the luck to hold out for very long! Therefore, could there be a leading indicator during a rampant spell of winners that could warn us that we could well be nearing the stage of pushing our luck? Could such an indicator give us some clues when feasting is about to give way to famine?

In forex currency trading, there is a technical indicator that can give advance clues when a certain currency is reaching an extreme level of being either overbought or oversold compared to another. The name of this particular indicator is the Relative Strength Index (RSI). And it's versatile enough to be applied across various markets beyond just currency pairs.
For financial traders, the Relative Strength Index (RSI) is a popular momentum oscillator that measures the speed and change of price movements. It fluctuates between readings of 0 and 100 and is commonly employed to pinpoint instances of overbought or oversold market conditions. Traders use the RSI to determine whether an asset is potentially overvalued (overbought) and due for a correction or undervalued (oversold) and due for a rebound. Extreme levels, such as 20 or 80, can give advance clues that price momentum is running out of steam. It's derived from the average gain and loss over a set period, often 14 days, offering useful insights into the intensity of price fluctuations.
One technique a market analyst can use is to sell a stock when the RSI indicator is giving a reading of 80 (i.e., overbought) or buy when it is giving a reading of 20 (i.e., oversold). The best way to understand this is to watch the following YouTube video, which I found online:
The RSI indicator is essentially looking to warn us in advance whenever a certain market is reaching a potentially dangerous extreme and thereby could be about to shift in the opposite direction.
So what could we use in horse racing to potentially give similar such advance warning clues of a possible big shift in momentum? Well how about analysing the strike rate? Let me demonstrate. The below chart shows the ongoing strike rate for SYS3 over the last 157 days of betting:
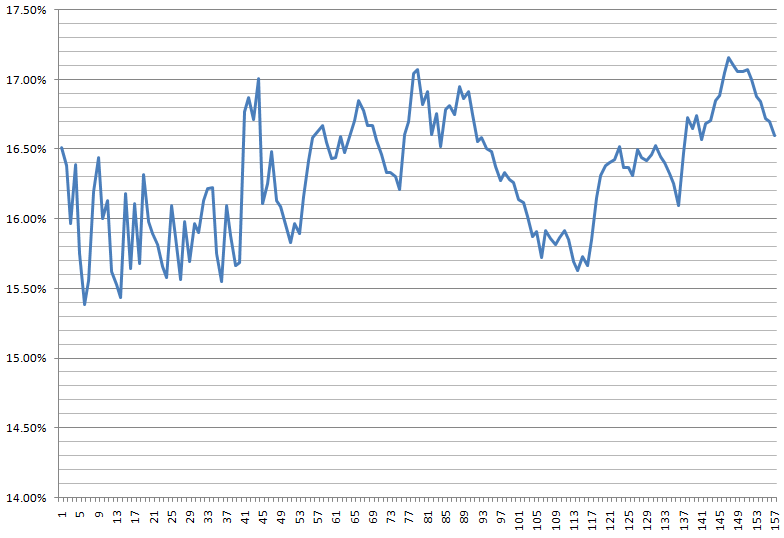
What can we determine from the above? Well, there seem to be two noticeable extremes that the ongoing strike rate pings between. When the current strike rate hits 17%, it could serve as a leading indicator, signalling a potential reversal to the downside on the horizon. Notice what has happened in recent days. For instance, on April 10th of this month, the current strike rate reached 17.05%, reflecting 155 winners out of 909 bets at that point. The next day, it increased to 17.16%, with 157 winners from 915 bets. However, since then, the strike rate has started to drop; in fact, after yesterday, it was down to 16.6% with 165 winners from 994 bets.
Now, let’s look at the bottom of this range. When the ongoing strike rate dips down as far as the 15.85% level, it could be a sign that the recent downturn is approaching its conclusion. Let’s compare this with the RSI settings of 80 (i.e., overbought and a signal to sell) and 20 (i.e., oversold and a signal to buy). For the above alternative for SYS3, we have strike rate settings of 17% (i.e., things are potentially overheating, so consider taking a break) and 15.85% (i.e., the downturn is nearing its end and it’s time to get back on board again).
If I had followed this exact method over the last 157 days of betting, 57 of those days I would have sat out on the sidelines. Remember these rules:
I wait patiently until the strike rate drops to 15.85%, then I jump back on.
Then, when the system strike rate heats back up to 17%, I sit out again until the strike rate drops back down to 15.85% again. So I’m looking to try and time the cycles to the upside and downside in a more efficient manner.
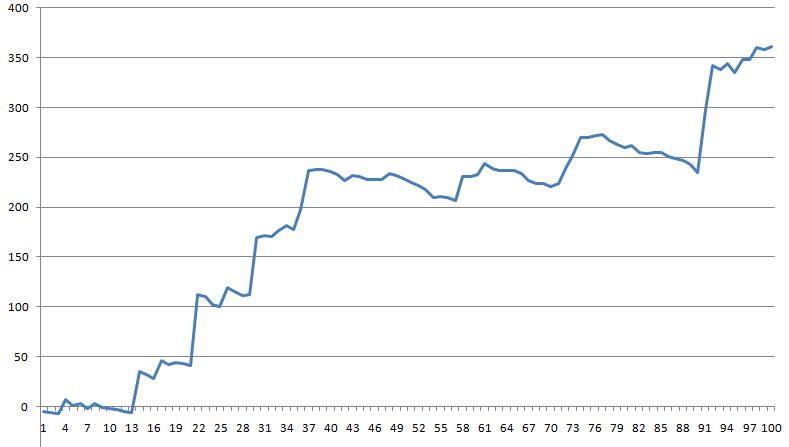
Here’s how SYS3 would have performed over this period by doing exactly as specified above (the line chart is plotted to Betfair SP prices):
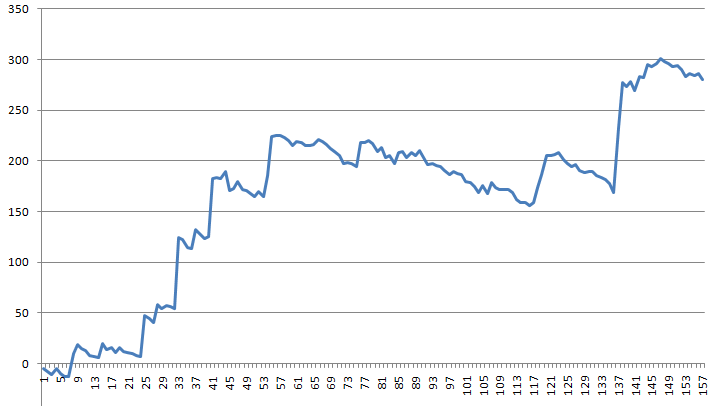
And here is SYS3 backing the previous 157 days rather than trying to time the market according to the strike rate levels specified:
Essentially, the former method has generated more points with fewer bets (meaning it’s more efficient with a better ROI%), as it’s required 57 fewer days of betting activity overall. Who wouldn’t want greater returns and only having to work 100 days instead of 157 for them too? Just to illustrate the point further, here is what happened on the 57 days of betting we sat out if following this method:
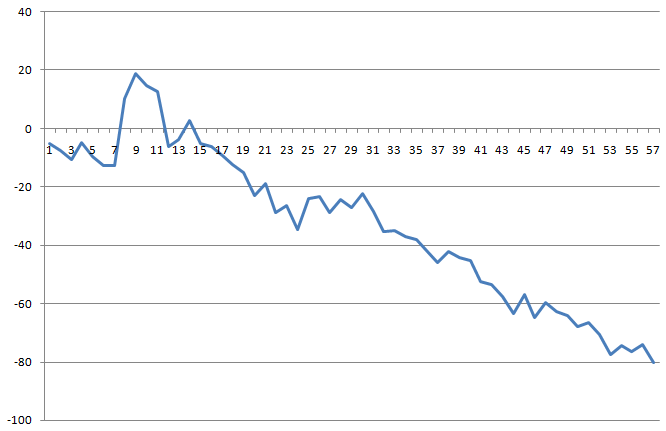
This is essentially the difference in points between the two charts above this one. Would you agree that those 57 days of betting look like days that were best missed overall?
Our Premium Members now get the following reading at the top of the SYS3 system sheet on a daily basis:

UPDATE NOTICE: I've decided to adjust the bottom-end target from 15.85% to a slightly higher figure of 16%. I've made this change because I think it is easier to work with a nice round whole number. Additionally, it hardly alters the overall strategy. Therefore, with this revision in mind:
I wait patiently until the strike rate drops to 16%, then I jump back on.
Then, when the system strike rate heats back up to 17%, I sit out again until the strike rate drops back down to 16% again. So I’m looking to try and time the cycles to the upside and downside in a more efficient manner.

The theme of wealth cycles has been expanded upon further exclusively for Premium Members in this post: